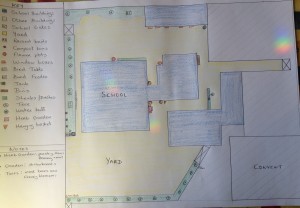
- Habitat Map 2014
- Key
This is our second Habitat Map which we created in 2013/2014. This map shows what we have done to increase the biodiversity in our school grounds. Please click on the images to see more details.
You can also visit the following page to see how we mapped out our data.
If you compare the two maps you can see that our grounds have changed a lot because of building work at the school. This decreased our green area but made us even more determined to increase and attract more species to our school.
Below is the Habitat Map (part one) of our school grounds in 2012/2013.
We carried out our survey on the 1st March 2013. It was sunny but cold and approximately 5 degrees Celsius. Each member of the green school committee had their own map and we marked out trees, bushes, window boxes, flower pots, bird tables and feeders and the different areas in our garden. We then compiled all that information together to make our habitat map.
Our map gives us an idea of what species are present in our school grounds and it will also help us find ways to increase the biodiversity.


